 WawaCoin
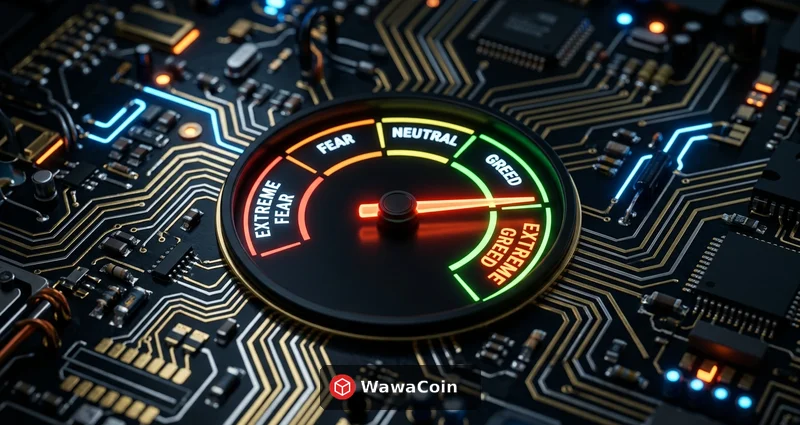
Key Summary
The Fear and Greed Index is a sentiment indicator that expresses the emotional state of cryptocurrency market participants as a number between 0 and 100. Originally developed by CNN Money for the stock market, Alternative.me adapted this concept for the crypto space. Updated daily, it shows market overheating and downturns in real-time.
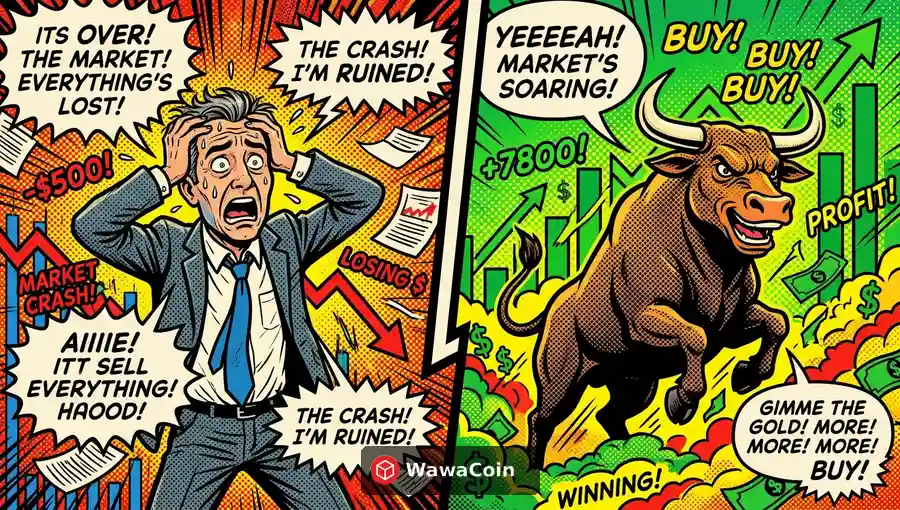
The importance of this index is clear: markets are driven by emotions. When people are fearful, overselling occurs; when gripped by greed, overbuying happens. Warren Buffett's famous saying "Be greedy when others are fearful" explains exactly this principle.
As of 2026, the Fear and Greed Index has become a key indicator referenced even by institutional investors. Following the Bitcoin ETF approval, traditional financial institutions have been paying close attention to this index. It's now regularly mentioned in Goldman Sachs and Morgan Stanley research reports.
This guide covers everything from the components of the Fear and Greed Index to historical patterns and practical investment strategies. We'll also explore how to interpret this index in the changed market environment following the 2024 halving.
Index Components and Calculation Methods
Volatility Indicator (25%)
The largest component of the Fear and Greed Index is volatility. It measures Bitcoin's current volatility compared to 30-day and 90-day averages. Abnormally high volatility is interpreted as a signal that the market is gripped by fear.
Specifically, Alternative.me uses Bitcoin's standard deviation as the baseline. For example, if the price fluctuation over the last 7 days exceeds 1.5 times the 90-day average, the score tilts toward fear. Conversely, if volatility is low with stable upward movement, the score shifts toward greed.
When Bitcoin dropped from $68,000 to $54,000 in January 2026, the volatility indicator alone pushed the index down to 15. Conversely, during the stable uptrend in March, this single component raised the index by over 20 points.
The volatility indicator has limitations too. Volatility also increases during sharp rallies, which could be misinterpreted as fear when it's actually a greedy state. That's why it must be considered alongside other indicators.
| Volatility Level | vs 90-Day Avg | Index Contribution | Interpretation |
|---|---|---|---|
| Very Low | Below 50% | +15 to 20 | Extreme Greed |
| Low | 50-80% | +5 to 15 | Greed |
| Normal | 80-120% | -5 to +5 | Neutral |
| High | 120-150% | -5 to 15 | Fear |
| Very High | Above 150% | -15 to 25 | Extreme Fear |
Trading Volume and Momentum (25%)
The second key component is trading volume and market momentum. It measures market participation by comparing current volume to 30-day and 90-day averages. High volume with rising prices indicates greed, while low volume with falling prices signals fear.
The buy/sell volume ratio is also an important variable. When taker buy volume on major exchanges exceeds sell volume, the score tilts toward greed. Data from the top 10 exchanges including Binance, Coinbase, and OKX is aggregated for calculation.
As of March 2026, the volume indicator is maintaining levels around 140% of average, sending a greed signal. The increased participation of institutional investors has also brought qualitative changes to trading volume.

Social Media and Surveys (30%)
Social media analysis examines the sentiment of cryptocurrency-related posts on Twitter (X), Reddit, Telegram, and other platforms. AI natural language processing measures positive/negative ratios and tracks the frequency of specific keywords (moon, dump, scam, etc.). This component accounts for 15% of the total.
Surveys poll thousands of investors weekly about market outlook. Responses to questions like "Will Bitcoin price rise next week?" are directly reflected in the index. This also carries a 15% weight.
The advantage of social media data is its real-time nature. When important news breaks, it's reflected in the index within hours. Surveys, updated weekly, show more stable trends.
Bitcoin Dominance and Google Trends Analysis
The remaining 20% is split between Bitcoin dominance and Google Trends at 10% each. Rising Bitcoin dominance is interpreted as a signal that the market has entered risk-off mode (fear). It indicates investors selling altcoins and flocking to Bitcoin.
Conversely, falling dominance indicates altcoin season, or a greed zone. As of 2026, Bitcoin dominance stands at 52%, showing a relatively balanced state.
Google Trends measures relative interest in search terms like "bitcoin," "buy bitcoin," and "bitcoin crash." Surging searches for "buy bitcoin" indicate greed, while increasing searches for "bitcoin crash" indicate fear.
Interestingly, Google Trends acts as a lagging indicator. By the time the general public starts searching, the market has already moved significantly. That's why this indicator is mainly used for "confirmation" purposes.
During the Bitcoin ETF approval in 2024, Google Trends alone added 8 points to the index. Major events can significantly amplify this component's impact.
| Component | Weight | Data Source | Update Frequency |
|---|---|---|---|
| Volatility | 25% | Exchange Price Data | Real-time |
| Volume/Momentum | 25% | Top 10 Exchanges | Real-time |
| Social Media | 15% | X, Reddit, Telegram | Hourly |
| Surveys | 15% | Alternative.me | Weekly |
| Bitcoin Dominance | 10% | CoinMarketCap | Daily |
| Google Trends | 10% | Google Trends API | Daily |
Historical Data Patterns of the Fear and Greed Index
The true value of the Fear and Greed Index is revealed through historical validation. Examining the signals this index gave from the 2018 crypto winter to the 2024 ETF approval provides valuable investment insights.
During the COVID crash in March 2020, the index dropped to 8. It was an all-time low. But a year later, Bitcoin hit a new all-time high of $64,000. Extreme fear was the best buying opportunity.
Conversely, in November 2021, at Bitcoin's $69,000 peak, the index recorded 84. It was extreme greed territory. Over the following year, Bitcoin dropped more than 70%. The index gave an accurate warning signal.
Even after the Bitcoin ETF approval in 2024, the index surged to 92 before crashing to 45 within a month. This mean reversion after extreme values is a highly consistent pattern.
| Period | Index | Bitcoin Price | 1-Year Return |
|---|---|---|---|
| March 2020 (COVID) | 8 | $4,800 | +1,233% |
| January 2021 | 95 | $40,000 | -50% |
| July 2021 | 10 | $29,000 | +138% |
| November 2021 | 84 | $69,000 | -75% |
| June 2022 | 6 | $17,500 | +195% |
| January 2024 (ETF) | 92 | $48,000 | +56% |
| August 2025 | 12 | $52,000 | +48% |
Investment Strategies Based on the Fear and Greed Index
Zone-Based Investment Strategies
The most basic way to use the Fear and Greed Index for investing is zone-based strategies. Divide into 0-24 (extreme fear), 25-49 (fear), 50 (neutral), 51-74 (greed), and 75-100 (extreme greed), then define actions for each zone.
Looking at historical data, buying when the index was below 20 resulted in an average return of 156% after one year. Conversely, buying above 80 resulted in an average loss of -23%. The numbers speak clearly.
Extreme Fear (0-24)
Start dollar-cost averaging Consider deploying 30-50% of cash reserves Long-term investment perspective required Keep potential for further decline in mind
Fear (25-49)
Maintain regular investment schedule Hold existing positions Use staged buying for new entries Avoid leverage
Greed (51-74)
Pause new purchases Consider partial profit-taking on positions Strengthen risk management Set stop-losses mandatory
Combining DCA with Fear and Greed Index
Combining Dollar-Cost Averaging (DCA) with the Fear and Greed Index creates a more effective strategy. Set a base investment amount and adjust based on the index. For example, if your base is $1,000/month, invest $2,000 when the index is below 20, and only $500 when above 70.
The advantage of this strategy is that it removes emotion. When the market crashes and you're scared, you buy more; when everyone is excited, you quietly reduce purchases. If you had used this strategy during the 2022 bear market, your average cost basis would have been 35% lower.
Backtesting results show that Fear and Greed-linked DCA outperformed simple DCA by an average of 12% annually. While past performance doesn't guarantee future results, it's a noteworthy figure.
Index 0-30 (Fear/Extreme Fear)
Deploy 150-200% of base investment Actively reduce cash holdings Set additional buy orders in advance Still avoid leverage
Index 30-70 (Neutral)
Maintain 100% base investment Continue planned regular investments No special action needed Monitor market while waiting
Index 70-100 (Greed/Extreme Greed)
Reduce to below 50% of base investment Consider taking 30-50% profits Increase cash allocation Minimize new purchases
Cautions and Limitations
The Fear and Greed Index is not a magic bullet. Markets can fall further even in extreme fear zones, and extreme greed can persist for months. In early 2021, the index stayed above 70 for four months, during which Bitcoin rose from $30,000 to $64,000.
Additionally, this index is designed around Bitcoin. It's difficult to directly apply it to individual altcoins. Solana or Ethereum may have different sentiment cycles than Bitcoin.

WawaCoin Outlook
Bullish Factors
Continued institutional inflows Healthy Bitcoin ETF fund flows 2024 halving effect ongoing Global liquidity expansion expected
Bearish Factors
Rate cut delay risks Geopolitical uncertainty Potential regulatory tightening Technical overbought conditions
Usage Tips
Refer to 7-day average over daily index Wait 3-5 days after extreme values Cross-verify with on-chain indicators Use as portfolio rebalancing signal
The current market is maintaining a healthy uptrend. While the Fear and Greed Index at 72 is in greed territory, compared to the 80-90 levels at the 2021 peak, there's still room. However, further gains could push into extreme greed, so caution is warranted.
In the short term, watch Bitcoin dominance. Currently stable at 52%, if this figure exceeds 60%, altcoin corrections and overall index decline become more likely.
In the medium to long term, the 2024 halving effect historically lasts 18-24 months. The overall uptrend is expected to continue through late 2026, though periodic corrections are inevitable. The Fear and Greed Index will serve as a good compass during those times.
Investors should also pay attention to the rate of index change. Gradual increases indicate healthy growth, while sharp spikes signal imminent corrections. Currently rising at a moderate 5-8 points per week, there are no overheating signals yet.
Investor Checklist
Key checklist items for effectively using the Fear and Greed Index in practice. Check these before every trade.
Check Current Index
Check the real-time index at Alternative.me. It's important to look at the 7-day and 30-day averages along with the daily index. Don't get swayed by short-term fluctuations.
Determine the Zone
Clearly recognize which zone (fear/neutral/greed) the current index is in. Maintain existing strategy near neutral (50), and only adjust strategy at extreme values.
Check Rate of Change
Monitor how quickly the index is changing. If it changes by more than 10 points in a day, a significant market event has occurred and you need to identify the cause.
Cross-Verify with Other Indicators
Check alongside other indicators like RSI, MVRV ratio, and funding rates. Confidence increases when multiple indicators point in the same direction.
Adjust Investment Amount
Pre-determine investment amounts based on the index. Having a plan for how much to invest in extreme fear versus greed helps avoid emotional decisions.
Set Profit-Taking Rules
Pre-determine profit-taking percentages for greed zones. A staged plan is needed, such as 20% at index 75, additional 20% at 85.
Frequently Asked Questions
Where can I check the Fear and Greed Index?
You can check it for free in real-time at the Alternative.me website. Apps are also available, and you can view it on CoinMarketCap or TradingView. Daily, weekly, monthly, and yearly charts are all provided free of charge.
Should I definitely buy when the index is near 0?
Not necessarily. Extreme fear can be a good buying opportunity, but further declines are possible. Approach with staged buying and invest only a portion of available funds first. In 2022, the index dropped to 6, but Bitcoin fell another 20% afterward.
Can this index be applied to altcoins other than Bitcoin?
The Fear and Greed Index is designed around Bitcoin, so direct application is difficult. However, you can indirectly reference it for large-cap altcoins with high Bitcoin correlation (Ethereum, Solana, etc.). Individual altcoins require separate analysis.
How should I interpret it if the index stays in one zone for a long time?
If the index stays in one zone for a long time, it means the trend in that direction is strong. Extended time in greed indicates a strong uptrend; extended time in fear indicates a strong downtrend. However, prolonged extreme readings increase the probability of reversal.
Can I invest based solely on the Fear and Greed Index?
Absolutely not recommended. The Fear and Greed Index is just one of many analysis tools. You should comprehensively consider on-chain data (MVRV, SOPR, etc.), technical analysis (RSI, MACD, etc.), and macroeconomic conditions.
When is the index updated?
The daily index is updated at UTC 00:00 (9 AM Korea Time). However, real-time data-based components (volatility, volume) are reflected continuously, so the value shown on the site is close to real-time.
The current index is 72 in 2026. Should I sell?
72 is in greed territory but hasn't entered extreme greed (75-100). No need to rush to sell, but approach new purchases cautiously. If it rises above 75, consider partial profit-taking. For existing holders, setting stop-losses is also an option.
Conclusion
The Fear and Greed Index is the emotional thermometer of the cryptocurrency market. A single number lets you gauge the psychological state of millions of investors. Since its debut in 2018, it has accurately predicted several market turning points, building credibility.
The key is contrarian investing. Look for buying opportunities when others are fearful (index below 25), and consider profit-taking when others are greedy (index above 75). Historical data shows this simple principle works over the long term.
However, blind following is dangerous. This index is merely a weighted average of 6 factors and doesn't reflect everything about the market. Factors like regulatory changes, technological developments, and macroeconomic trends need separate analysis.
In practice, combining with DCA strategy is effective. Setting a base investment amount and adjusting the ratio based on the index enables systematic, emotion-free investing. Backtesting results also support this strategy's effectiveness.
As of 2026, the index at 72 is in greed territory. This means the market is optimistic, but not yet overheated. Consider partial profit-taking when entering the 75-80 zone, and approach new purchases more conservatively.
Finally, the Fear and Greed Index should be used as a medium to long-term directional indicator, not a short-term timing tool. Just because the index is 70 today doesn't mean it will drop tomorrow. Reading the bigger picture by looking at 7-day and 30-day average trends is important.
Make it a habit to check the index daily at Alternative.me. Simply sensing the market's temperature can help you make better investment decisions. Invest with data, not emotions.