 WawaCoin
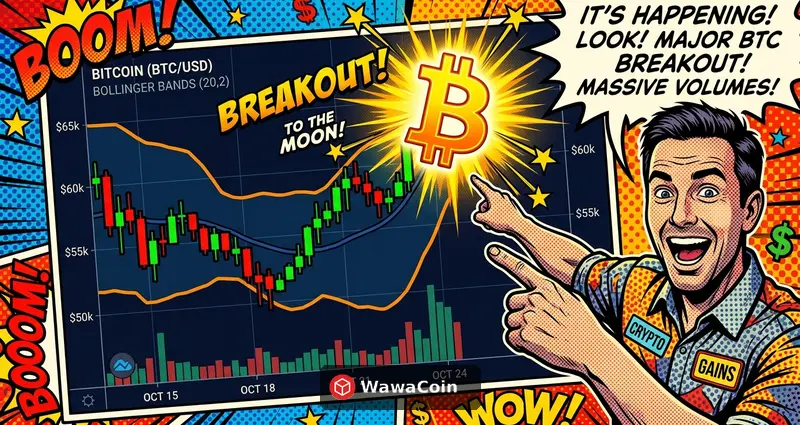
Key Summary
Bollinger Bands are a volatility-based technical analysis tool developed by John Bollinger in the 1980s. They draw upper and lower bands using standard deviation around a moving average centerline.
The cryptocurrency market has much higher volatility than traditional financial markets, making Bollinger Bands particularly valuable. It's common to see Bitcoin move 10% or more in a single day.
As of 2026, most exchanges and charting platforms offer Bollinger Bands as a standard indicator. You can easily apply them on Binance, Bybit, Upbit, and other platforms.
This guide covers everything from basic Bollinger Band principles to advanced crypto-specific trading strategies. If you've already read our RSI Indicator Guide and MACD Indicator Guide, you'll find this even easier to understand.
Bollinger Bands Fundamentals and Calculation
Understanding the Three Bands
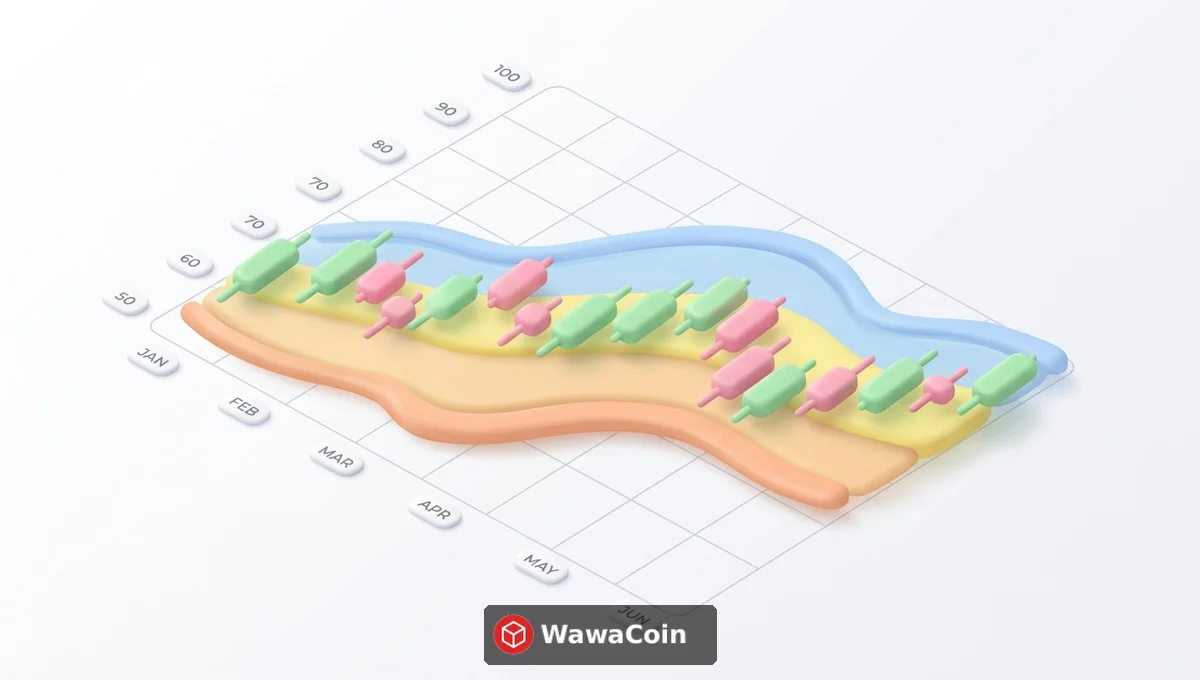
Bollinger Bands consist of three lines. The middle band is a Simple Moving Average (SMA), while the upper and lower bands are calculated by adding or subtracting standard deviation.
The Middle Band is typically a 20-day Simple Moving Average. It serves as a baseline showing average price movement. Many traders also use this line as support and resistance.
The Upper Band equals the middle band plus 2 times the standard deviation. Statistically, prices have only about a 2.5% chance of trading above this line. That's why touching the upper band is interpreted as an overbought signal.
The Lower Band conversely subtracts 2 times the standard deviation. When price reaches this level, it's considered an oversold zone. This is a frequently referenced point for Crypto Analysis when timing purchases.
| Band Type | Calculation Formula | Interpretation |
|---|---|---|
| Upper Band | 20-day SMA + (Std Dev × 2) | Overbought Zone |
| Middle Band | 20-day SMA | Average Price, Support/Resistance |
| Lower Band | 20-day SMA - (Std Dev × 2) | Oversold Zone |
Standard Deviation and Volatility Relationship
Standard deviation quantifies how much prices deviate from the average. When volatility increases, standard deviation grows larger, and the bands widen.
Cryptocurrency market volatility averages 3-5 times that of traditional stock markets. This makes Bollinger Bands move more dynamically. You'll often see bands rapidly expand during Bitcoin surges or crashes.
When volatility decreases, bands narrow—this is called a Squeeze. Since big price movements typically follow squeezes, traders pay close attention to this signal.

Default Settings and Crypto Optimization
John Bollinger's recommended default settings are 20-day moving average with 2x standard deviation. However, since crypto markets operate 24/7/365, many traders adjust these settings.
For short-term trading, some use 10-day moving average with 1.5x standard deviation. This provides more sensitive signals useful for scalping or day trading.
Long-term investors sometimes apply 50-day or 200-day moving averages. Combined with long-term cycle analysis covered in our Bitcoin Complete Guide, this helps identify major trends.
Bollinger Bands History and Evolution
In 1983, John Bollinger was working as a financial market analyst and felt the limitations of existing band indicators. Most band indicators at the time used fixed widths, unable to adapt to volatility changes.
Bollinger introduced statistical standard deviation concepts to develop an indicator where band width automatically adjusts to market conditions. After its initial release in the late 1980s, it quickly gained popularity.
In 2001, he published Bollinger on Bollinger Bands, systematically documenting usage methods. This book also introduced the %B indicator and BandWidth indicator.
As cryptocurrency markets grew, Bollinger Bands usage surged dramatically. During the 2017 Bitcoin bull run and 2020-2021 DeFi boom, it became an essential indicator among traders.
By 2026, AI-based trading bots also use Bollinger Bands as a core input. Its value as the foundation for volatility-based strategies has been proven.
| Year | Key Event | Significance |
|---|---|---|
| 1983 | Bollinger Bands concept developed | Volatility-adaptive band idea |
| 1987 | Official release and naming | Trading community adoption begins |
| 2001 | Official book published | %B, BandWidth systematized |
| 2017 | Crypto market adoption expands | Becomes essential Bitcoin trading tool |
| 2024-26 | AI trading integration | Core input for automated strategies |
%B Indicator and BandWidth Deep Dive
The %B indicator shows where the current price sits within the bands as a value between 0 and 1. A value of 1 means the upper band, 0 means the lower band, and 0.5 means the middle band.
When %B exceeds 1, price has broken above the upper band; below 0 means it's fallen below the lower band. Extreme values increase the probability of a reversal.
BandWidth is the distance between upper and lower bands divided by the middle band. Narrowing BandWidth indicates volatility contraction, while widening indicates expansion.
| Indicator | Formula | Value Interpretation | Application |
|---|---|---|---|
| %B | (Price - Lower) ÷ (Upper - Lower) | 0-1 normal, below 0/above 1 extreme | Precise overbought/oversold detection |
| BandWidth | (Upper - Lower) ÷ Middle × 100 | Lower = Squeeze | Volatility breakout prediction |
| 6-Month Low BandWidth | Lowest value in past 126 days | Squeeze confirmation | Prepare for big moves |
Practical Trading Strategies: 4 Core Patterns
Pattern 1: Band Touch Counter-Trend Trading
The most basic strategy: buy when price touches the lower band, sell when touching the upper band. Effective in ranging markets but risky in trending markets.
Combining with momentum indicators like RSI or Stochastic increases signal accuracy. Lower band touch + RSI below 30 is a classic combination.
Set stop-losses when price closes outside the bands. If price doesn't return after breaking out, it could signal a trend reversal.
Buy Signal Conditions
Price touches or breaks below lower band. RSI below 30 increases reliability. Volume decreases then increases. Candlestick patterns (hammer, bullish engulfing) confirm.
Sell Signal Conditions
Price touches or breaks above upper band. RSI above 70 increases reliability. Volume spikes then decreases. Candlestick patterns (shooting star, bearish engulfing) confirm.
Cautions
Sell signals may be ignored in strong uptrends. Buy signals may be ignored in strong downtrends. Stop-loss setting is mandatory. Extra caution with leverage.
Pattern 2: Squeeze Breakout Trading
When BandWidth narrows to 6-month lows and then starts expanding, a significant price move is beginning. While direction is hard to predict, you can trade volatility itself.
During a squeeze, observe which direction price first breaks the bands. Upper breakout suggests long, lower breakout suggests short—this is the basic strategy.
On exchanges like Binance, straddle or strangle options strategies can profit from volatility expansion regardless of direction.
Squeeze Identification
BandWidth approaching 6-month lows. Bollinger Bands narrowly converging. Volume continuously declining. Price consolidating in tight range.
Breakout Entry Conditions
Close above upper band → Long. Close below lower band → Short. Confirm volume surge. BandWidth starting to expand.
Stop-Loss and Exit
Exit on opposite band touch. Reassess if BandWidth contracts again. Target previous swing highs/lows. Trailing stops recommended.
Pattern 3: Band Walking
In strong trends, price walks along the bands. In uptrends, it rides the upper band; in downtrends, the lower band.
During band walking, don't interpret band touches as counter-trend signals. Rather, view them as trend continuation signals. The middle band acts as support/resistance.
2026 Bollinger Bands Market Outlook
Bullish Factors
Increasing adoption by AI trading systems. Continued alpha confirmation in volatility strategies. High suitability for crypto volatility environment. Growing institutional technical analysis usage.
Bearish Factors
Reduced signal effectiveness from overuse. Potential exploitation by HFT bots. Unclear signals during low volatility. Persistent band breaks during black swan events.
Usage Tips
Always combine with RSI, MACD. Verify with on-chain data. Optimize settings per timeframe. Backtest strategies thoroughly.
The cryptocurrency market's high volatility is a double-edged sword for Bollinger Bands usage. Signals occur frequently, but so do false positives.
As of 2026, Bitcoin ETF inflows have stabilized, changing volatility patterns from before. Institutional capital influence has increased squeeze-breakout pattern reliability.
Altcoin markets still see frequent dramatic moves after band breaks. Coins outside the top 100 by market cap especially need more sensitive Bollinger Band settings.
A key point to watch is how AI trading bots utilize Bollinger Bands. If too many bots react to the same signals, it could create adverse effects.
Investor Checklist
Essential items to verify before applying Bollinger Bands to live trading.
Verify Default Settings
Confirm your moving average period and standard deviation multiplier match your trading style. Scalping typically uses 10-day/1.5x, swing trading uses 20-day/2x.
Combine Secondary Indicators
Never make trading decisions based on Bollinger Bands alone. Validating signals with at least 2 other indicators like RSI, MACD, or volume is essential.
Assess Market Conditions
First determine if the current market is trending or ranging. Use counter-trend strategies in ranges, consider band walking in trends.
Set Stop-Losses
Set clear stop-losses for all positions. If price closes outside bands for 2 consecutive days, suspect a trend reversal.
Check Volume
Always verify volume changes alongside band signals. Band touches without volume confirmation have low reliability.
Conduct Backtesting
Before applying new settings or strategies, backtest against historical data. Confirm win rate with at least 100 signals.
Frequently Asked Questions
What are the default Bollinger Bands settings?
John Bollinger recommends 20-day Simple Moving Average with 2x standard deviation. This setting positions approximately 95% of prices within the bands. For cryptocurrency markets, traders may adjust between 10-50 days depending on volatility.
Is an upper band touch always a sell signal?
No. In strong uptrends, price walks along the upper band—a phenomenon called band walking. In this case, upper touches signal trend continuation. Accurate interpretation requires combining with RSI, volume, and other indicators.
How do you identify a squeeze?
A squeeze occurs when the BandWidth indicator reaches 6-month lows. Most charting platforms allow adding BandWidth as a separate indicator. You can also visually confirm Bollinger Bands converging very tightly.
Should I change Bollinger Band settings for crypto?
Default settings work fine for highly volatile cryptocurrencies. However, using 10-14 day moving averages for short-term trading or 50-day for long-term analysis can provide more accurate signals.
How do I use the %B indicator?
%B below 0 indicates oversold, above 1 indicates overbought. Turning down from above 0.8 suggests sell, turning up from below 0.2 suggests buy. Divergence is also important—if price makes new highs but %B drops, it's bearish.
Which indicators work best with Bollinger Bands?
RSI and MACD are most commonly used. Lower band + RSI below 30 is recognized as a strong buy signal. Volume indicators are also essential—band signals with volume surges have higher reliability.
Conclusion
Bollinger Bands are a proven technical analysis tool with over 40 years of history. Their value shines even brighter in the high-volatility cryptocurrency market.
Three key points: First, understand what the bands mean. Upper indicates overbought, lower indicates oversold, but band walking can occur in trending markets.
Second, watch for squeeze patterns. Narrowing BandWidth signals an imminent big move. Since direction is hard to predict precisely, following the breakout direction is a valid strategy.
Third, never use Bollinger Bands alone. Always combine with RSI, MACD, volume, and other indicators. Adding on-chain data enables even more accurate decisions.
Adjust settings to match your personal trading style. Scalpers should use more sensitive settings, swing traders should use default or slower settings.
As cryptocurrency markets institutionalize in 2026, technical analysis effectiveness has increased compared to the past. This is why classic tools like Bollinger Bands remain powerful.
Finally, don't forget backtesting and risk management. No indicator is 100% accurate. Always set stop-losses and avoid risking too much on any single trade—this is the key to long-term success.
For more technical analysis guides on Crypto Analysis, please check out other analysis articles on WawaCoin.