 WawaCoin
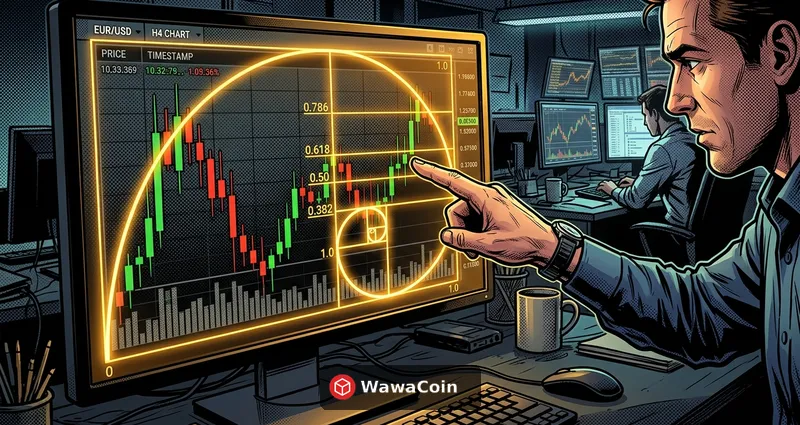
Key Summary
Fibonacci retracement is the most widely used support and resistance prediction tool in technical analysis. Based on the golden ratio 1.618, this technique originates from the sequence discovered by Italian mathematician Leonardo Fibonacci centuries ago.
In the cryptocurrency market, where volatility is high, accurately predicting correction zones directly impacts profits. Fibonacci retracement shows how much price is likely to retrace after an uptrend or downtrend probabilistically.
As of 2026, Fibonacci levels are working remarkably accurately on Bitcoin and Ethereum charts. Institutional investors' algorithmic trading also uses Fibonacci levels as key parameters.
This guide comprehensively covers the mathematical principles of Fibonacci sequences, practical meanings of each retracement level, combination strategies with other indicators, and real cryptocurrency chart application examples.
Fibonacci Sequence and Golden Ratio Principles
What is the Fibonacci Sequence?
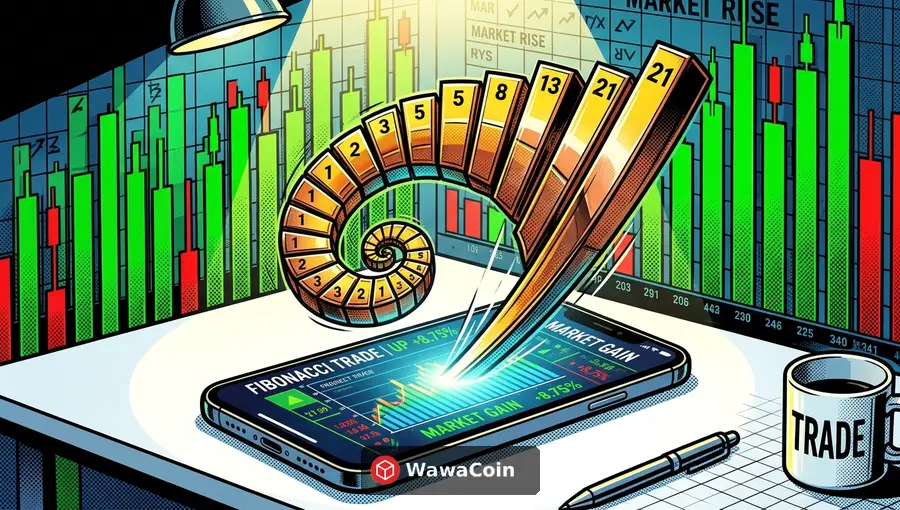
The Fibonacci sequence starts with 0 and 1, where each subsequent number is the sum of the two preceding ones. It continues infinitely: 0, 1, 1, 2, 3, 5, 8, 13, 21, 34, 55, 89, 144...
The key to this sequence is that the ratio of adjacent numbers converges to a specific value. For example, 144÷89=1.6179..., 89÷55=1.6181... The larger the numbers, the closer they approach the golden ratio 1.618.
This ratio is found throughout nature: sunflower seed arrangements, nautilus shell spirals, and even galaxy structures. It's also considered the most aesthetically pleasing ratio by humans, used in ancient Greek Parthenon architecture.
The reason this ratio works in financial markets is due to collective psychology of market participants. When many traders watch Fibonacci levels, buying and selling actually concentrate at those levels, creating self-fulfilling prophecies.
| Fibonacci Ratio | Calculation Method | Practical Meaning |
|---|---|---|
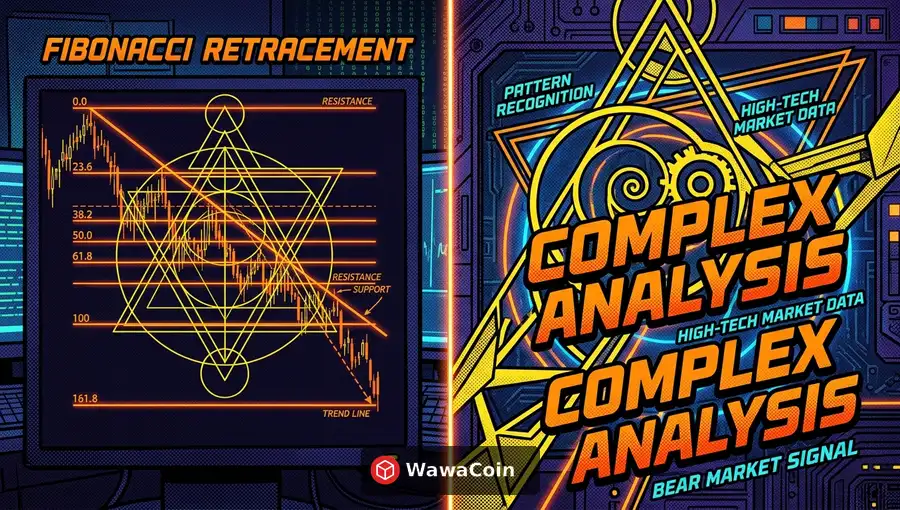
| 23.6% | 0.236 = 1 - 0.764 | Shallow correction, strong trend continuation |
| 38.2% | 0.382 = 1 - 0.618 | Primary support, healthy correction start |
| 50.0% | 0.500 (midpoint, not ratio) | Psychologically important level |
| 61.8% | 0.618 = 1/1.618 | Golden ratio, strongest support |
| 78.6% | 0.786 = √0.618 | Last defense, trend reversal boundary |
Special Significance of Golden Ratio 0.618
The golden ratio 0.618 (61.8%) is the most important level in Fibonacci retracement. This ratio has unique mathematical properties—it's the only number that equals itself when 1 is divided by it.
In cryptocurrency charts, the 61.8% retracement level is known as the key institutional buying zone. During Bitcoin's 2024 correction phase, price bounced precisely from this level.
Statistically, over 70% of Bitcoin's historical post-rally corrections bounced within the 38.2%~61.8% zone. This demonstrates that Fibonacci retracement is a practically verified tool, not just theory.

Role of Other Fibonacci Levels
23.6% is the shallowest retracement, appearing when strong trends continue. A bounce from this level signals extremely strong trend momentum.
38.2% is the healthy primary correction zone. Many traders attempt their first scaled entry at this level.
50% isn't technically a Fibonacci ratio but is psychologically important as the midpoint. The intuitive meaning of half retracement draws market attention.
History and Evolution of Fibonacci Retracement
Fibonacci retracement was formally applied to financial markets in Ralph Nelson Elliott's Wave Theory in the 1930s. Elliott proposed that markets move in 5 impulse waves and 3 corrective waves, discovering that each wave's ratios follow Fibonacci sequences.
With the 1970s computer technology advancement, chart analysis became mainstream, establishing Fibonacci retracement as a core tool of technical analysis. Levels previously calculated by hand could now be automatically drawn by software.
The 2010s cryptocurrency market emergence brought a new golden age for Fibonacci retracement. The 24/7 operation, high volatility, and high proportion of technically-oriented investors created an environment where Fibonacci levels work particularly well.
In the 2020s, AI-based trading bots integrating Fibonacci levels into algorithms have further strengthened the self-fulfilling prophecy effect. Countless bots placing buy/sell orders at the same levels amplifies this phenomenon.
As of 2026, the trend is to use Fibonacci retracement in combination with RSI, MACD, Bollinger Bands rather than alone. This strategy complements single indicator limitations while improving accuracy.
| Era | Development | Key Figure/Technology | Impact |
|---|---|---|---|
| 1930s | Elliott Wave Theory integration | Ralph Nelson Elliott | Technical analysis foundation established |
| 1970s | Computer chart analysis introduced | Chart software | Mainstream adoption began |
| 2010s | Cryptocurrency market application | Bitcoin traders | 24/7 market optimization |
| 2020s | AI algorithm integration | Trading bots | Self-fulfilling effect maximized |

How to Draw Fibonacci Retracement
To draw Fibonacci retracement, first identify a clear trend. For uptrends, apply the tool from low to high; for downtrends, from high to low.
Most chart platforms (TradingView, Binance Chart, etc.) have built-in Fibonacci retracement tools. Select Fibonacci retracement from the left tool menu, click start and end points, and levels are automatically displayed.
The key consideration is selecting start and end points. Levels are reliable only when you accurately capture the lowest and highest points. Whether to use candle bodies (open/close) or wicks (high/low) varies by trader.
Generally, Fibonacci levels drawn on daily or higher timeframes have higher reliability. Minute or hourly charts have too much noise, causing frequent level breaches.
| Timeframe | Suitable Trading Style | Reliability | Noise Level | Recommended Use |
|---|---|---|---|---|
| 1-15 min | Scalping | Low | Very High | Short-term entry reference |
| 1-4 hour | Day trading | Medium | Medium | Intraday trading basis |
| Daily | Swing trading | High | Low | Core support/resistance |
| Weekly/Monthly | Long-term investing | Very High | Very Low | Major trend analysis |
Practical Trading Strategies: Level-by-Level Response
23.6%~38.2% Zone Strategy
A bounce in this zone signals extremely strong trend. Entering after confirming a bounce at 38.2% is a relatively safe strategy.
Precise bounces at 23.6% are rare. This level is more effectively used as a stop-loss reference point.
When RSI shows oversold (below 30) at 38.2% level, buy signal strength increases. Probability improves when both indicators signal simultaneously.
23.6% Level Signals
Extremely strong trend continuing Hold long positions Caution on chasing highs (near top) Consider partial profit taking
38.2% Level Signals
Healthy primary correction First scaled entry point Must confirm RSI oversold Stop-loss below 50% level
Strategy Core
Confirm with volume Support with candlestick patterns Position size under 30% Enter after bounce confirmation
50%~61.8% Zone Strategy
The 61.8% golden ratio is the core support line of Fibonacci retracement. When correction reaches this level, it's time for second scaled entry.
Price often consolidates between 50% and 61.8%. Sufficient time correction in this zone strengthens the next upward move.
If 61.8% clearly breaks on a closing basis, consider trend reversal possibility. Reduce positions or consider hedging at this point.
50% Level Response
Psychologically important support Half retracement = balanced state Direction-deciding zone Wait and see or small entry
61.8% Level Response
Golden ratio strongest support Key zone for 2nd scaled entry Expect strong rise on bounce Prepare for 78.6% test on breakdown
Risk Management
Stop-loss on 61.8% breakdown Keep position under 50% Avoid leverage Use scaled entry for cost averaging
Response on 78.6% Breakdown
78.6% is the last defense line. Decline to this level suggests high probability that the existing trend has ended.
After 78.6% breakdown, redraw Fibonacci from high to new low. The previous rally may be 100% retraced with a new downtrend beginning.
Fibonacci + Other Indicator Combination Strategies
RSI Combination (Confirmation Enhancement)
61.8% + RSI below 30 = Strong buy 38.2% + RSI above 70 = Overheated warning Increased reliability with divergence Enter only when both signals align
MACD Combination (Trend Confirmation)
Fibonacci level + Golden cross = Bullish turn Fibonacci level + Death cross = Bearish turn Confirm histogram direction change Use signal line crossover timing
Bollinger Bands Combination (Volatility)
Lower band + 61.8% overlap = Buy zone Upper band + 23.6% overlap = Take profit zone Watch for band squeeze then expansion Reduce leverage during volatility expansion
The true value of Fibonacci retracement lies in probabilistic edge. You can't succeed 100% in every trade, but it's a tool that improves win rate over the long term.
As of 2026, institutional investor algorithms widely use Fibonacci levels, further strengthening the self-fulfilling prophecy effect.
Whenever Bitcoin reaches new highs, Fibonacci retracement will be used as a core tool for predicting correction zones. Practice consistently and refine your own strategy through backtesting.
Investor Checklist
Essential items to check before applying this guide to real trading.
Trend Identification
Confirm a clear uptrend or downtrend exists. Fibonacci retracement reliability is low in sideways markets. Apply to waves with at least 20% price movement.
Timeframe Selection
Prioritize levels drawn on daily or higher timeframes. Use short timeframes for reference only; make key decisions based on daily/weekly levels.
Supporting Indicators Check
Check RSI overbought/oversold when reaching Fibonacci levels. Analyze with at least 2+ indicators including MACD crossovers and Bollinger Bands position.
Scaled Entry Plan
Never invest all capital at once. Plan scaled entries at 38.2%, 50%, 61.8% zones and predetermine allocation for each zone.
Stop-Loss Setting
Always set stop-loss before entry. For 61.8% buy, set stop at 78.6% breakdown; for 38.2% buy, set stop at 50% or 61.8% breakdown.
Target Setting
Predetermine profit-taking targets on bounces. Use previous high plus 23.6%, or Fibonacci extension 127.2%, 161.8% levels as targets.
Frequently Asked Questions
Why does Fibonacci retracement work?
Fibonacci retracement works due to self-fulfilling prophecy. Countless traders and algorithms worldwide watch the same levels, concentrating buy/sell orders there. Additionally, the golden ratio is naturally imprinted in human psychology, reflected in collective market participant behavior.
Which timeframe works best?
Generally, daily or higher timeframes have the highest reliability. 4-hour charts are also useful for day trading, but levels drawn on minute or hourly charts have too much noise and frequently break. Long-term investors should use weekly or monthly levels as core support/resistance.
What's the difference between Fibonacci retracement and extension?
Retracement is a tool for predicting correction zones within existing trends. Extension predicts the next targets when trends continue. Retracement uses levels between 0%~100%, while extension uses levels above 100% (127.2%, 161.8%, 261.8%, etc.).
What should I do if 61.8% level breaks?
If 61.8% clearly breaks on a closing basis, consider trend reversal possibility. Prepare for further decline to the 78.6% level and stop-loss or significantly reduce existing long positions. If 78.6% also breaks, redraw Fibonacci for the new downtrend.
Why does Fibonacci work better in crypto than stocks?
The cryptocurrency market has high technical analysis dependency. Due to 24-hour trading, high volatility, and difficulty in fundamental analysis, traders focus on chart-based trading. Consequently, orders concentrate more at Fibonacci levels, strengthening the self-fulfilling effect.
Can I trade using only Fibonacci?
Not recommended. Fibonacci retracement is a probabilistic tool, not an absolute prediction tool. Use it with at least 2-3 indicators including RSI, MACD, and volume for higher reliability. Entering based solely on Fibonacci without stop-loss can lead to significant losses.
Conclusion
Fibonacci retracement is a powerful technical analysis tool applying centuries-old mathematical principles to modern financial markets. Centered on the golden ratio 0.618, levels at 23.6%, 38.2%, 50%, 61.8%, and 78.6% function as support and resistance.
Fibonacci retracement is particularly effective in the cryptocurrency market. High volatility, technical analysis-oriented investor base, and algorithmic trading proliferation maximize the self-fulfilling prophecy effect.
In practical trading, use in combination with RSI, MACD, Bollinger Bands rather than alone. When RSI oversold and MACD golden cross appear simultaneously at 61.8%, it can be considered an optimal buy signal.
Timeframe selection is also important. Levels drawn on daily or higher have higher reliability; use short timeframes for reference only. Scaled entry and stop-loss setting are essential.
Fibonacci retracement is not a magic tool that predicts the future 100%. However, it's a verified analysis technique that provides probabilistic edge. Develop your own strategy through consistent practice and backtesting.
The 2026 cryptocurrency market is maturing with expanded institutional participation. Building a solid foundation with tools like Fibonacci retracement will help you respond calmly to any market condition.