 WawaCoin
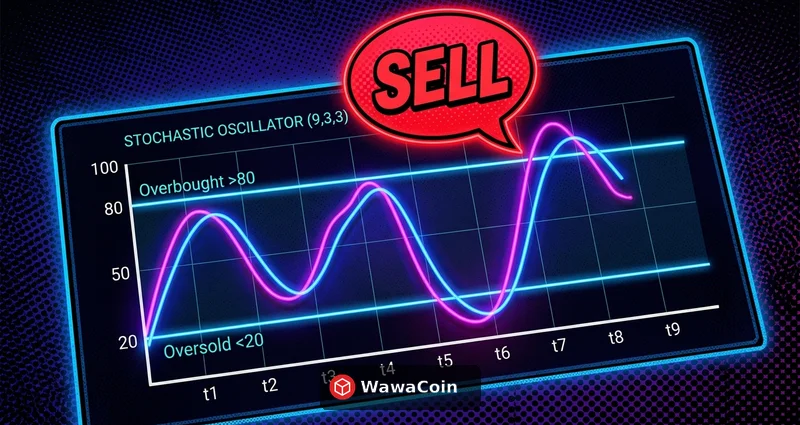
Key Summary
The Stochastic Oscillator is a momentum indicator that shows where the current closing price sits within a specified period's price range. Developed by George Lane in the 1950s, this indicator has been trusted by traders for over half a century.
The core principle is straightforward. In uptrends, closing prices tend to form near the highs, while in downtrends, they form near the lows. The Stochastic quantifies this principle into a value between 0 and 100.
The cryptocurrency market trades 24/7 with high volatility, making the Stochastic particularly valuable. It's especially useful for timing short-term trades in Bitcoin and altcoins. Many traders actually use Stochastic alongside RSI as complementary indicators.
This guide covers everything from the Stochastic Oscillator's fundamentals to %K and %D line interpretation, golden cross and death cross signals, divergence pattern strategies, and real-world cryptocurrency trading tactics. Reading this alongside the RSI Indicator Guide will enhance your technical analysis skills.

Stochastic Oscillator Fundamentals
Understanding %K and %D Lines
The Stochastic Oscillator consists of two lines. The %K line, also called the fast stochastic, shows where the current close sits within the set period's price range. The formula is: (Current Close - Lowest Low) / (Highest High - Lowest Low) × 100.
The %D line is a moving average of %K, typically using a 3-period simple moving average. %D moves slower than %K, and the crossovers between these lines generate trading signals. Understanding the relationship between %D as the signal line and %K is the first step to mastering Stochastic.
Default settings are 14 periods for %K and 3 for %D, but adjustments may be needed based on cryptocurrency market volatility. Short-term trading might use 9 or 5 periods, while swing trading might extend to 21 periods.
The patterns created by these two lines moving together form the core basis for trading decisions. When %K crosses above %D, it's a buy signal; when it crosses below, it's a sell signal—that's the basic interpretation.
| Component | %K (Fast Line) | %D (Slow Line) |
|---|---|---|
| Calculation | (Close-Low)/(High-Low)×100 | 3-period MA of %K |
| Response Speed | Fast (price-sensitive) | Slow (filters noise) |
| Role | Current momentum display | Signal line (confirmation) |
| Default Period | 14 days | 3 days |
| Crypto Recommended | 9-14 (volatility adjusted) | Keep at 3 |
Comparing Fast, Slow, and Full Stochastic
There are three versions of Stochastic. Fast Stochastic uses the original formula as-is, making it very sensitive with lots of noise. In volatile markets like cryptocurrency, frequent false signals (whipsaws) can occur.
Slow Stochastic smooths Fast %K with a 3-period moving average. This is the standard version most traders use. While less sensitive, signals are more reliable, making it suitable for crypto trading.
Full Stochastic allows users to adjust all parameters. You can customize the %K period, %K smoothing period, and %D period, which professional traders prefer. The advantage is being able to optimize for your own trading style.

Understanding Overbought and Oversold Zones
When the Stochastic value is above 80, it's in the overbought zone. This means the current price is near the high of the set period's range. However, overbought doesn't mean you should sell immediately. In strong uptrends, the Stochastic can stay overbought for extended periods.
Conversely, below 20 is the oversold zone. While this signals the price is near the low, it's not an immediate buy signal either. In strong downtrends, the Stochastic can remain in oversold territory—this is called a slump condition.
The key is to focus not on entering overbought/oversold zones but on exiting them. When price rises out of oversold territory, that's buy timing; when it falls out of overbought territory, that's sell timing.
History and Evolution of the Stochastic Oscillator
The Stochastic Oscillator was developed by George Lane in the late 1950s. At the time, he was a trader and technical analyst active at the Chicago futures exchange. Lane famously said, "Stochastic measures momentum, not price or volume."
During the 1960s-70s, it was primarily used in futures and commodity markets. Without computers, calculations had to be done by hand, limiting use to professional traders. However, its effectiveness was proven, gradually attracting more interest.
With the spread of personal computers in the 1980s, Stochastic began its democratization. As charting software included it by default, regular investors could easily access it. This era established Slow Stochastic as the standard.
Since the 2010s, with the emergence of cryptocurrency markets, Stochastic has experienced a new golden age. Its excellence at capturing short-term momentum in 24/7 high-volatility markets has been re-evaluated. Today, it's one of the most-used indicators alongside the MACD Indicator Guide and Bollinger Bands Guide.
In the 2020s, AI and algorithmic trading advances have spawned bots that automate Stochastic signals. However, understanding the fundamentals remains crucial. You need to know an indicator's limitations to use it properly.
| Era | Major Development | Applied Markets | Characteristics |
|---|---|---|---|
| 1950s | George Lane development | Futures/Commodities | Manual calculation |
| 1970s | %D line added | Stocks/Futures | Signal smoothing |
| 1980s | Included in chart software | All markets | Mass adoption begins |
| 2000s | Online trading expansion | Forex/Futures | Real-time analysis |
| 2020s | Crypto/Algo trading | Crypto | 24/7 utilization |
Golden Cross and Death Cross Trading Strategies
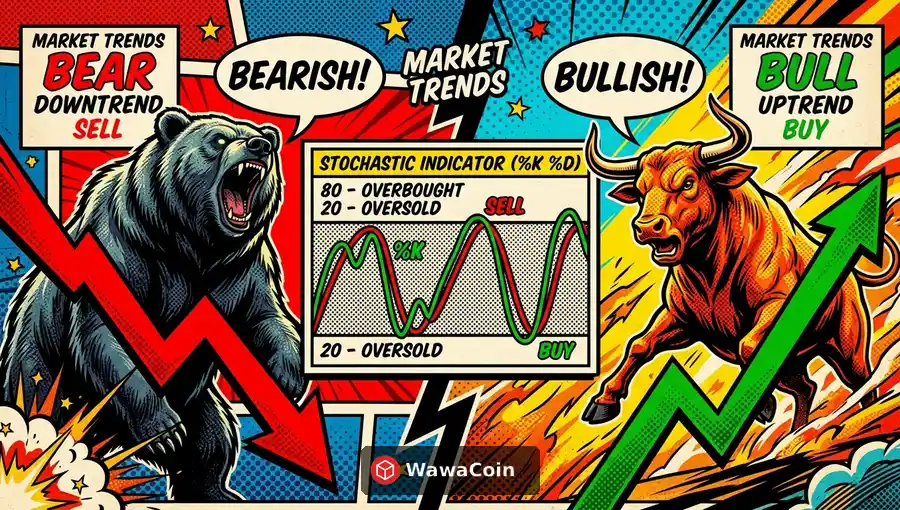
A Golden Cross occurs when the %K line crosses above the %D line from below. This signals strengthening short-term momentum, interpreted as buy timing. Golden crosses occurring in oversold territory (below 20) are particularly strong buy signals.
A Death Cross is the opposite—%K crossing below %D from above. This warns of weakening momentum, signaling potential sells or profit-taking. Death crosses in overbought territory (above 80) are especially reliable.
However, making trading decisions on crossovers alone is risky. In ranging markets, frequent crossovers generate many false signals. Using a trend filter, as covered in the Moving Average Guide, can improve reliability.
In practice, waiting for a confirmation candle after the crossover is advisable. Confirming that the direction holds on the next bar after the signal before entering reduces your chances of getting caught in false signals.
| Signal Type | Condition | Reliability | Recommended Action | Additional Confirmation |
|---|---|---|---|---|
| Strong Buy | Golden cross below 20 | Very High | Aggressive buy | Volume increase check |
| Regular Buy | Golden cross at 20-50 | Moderate | Scale in | Trend line check |
| Weak Buy | Golden cross above 50 | Low | Wait recommended | Watch for overbought |
| Strong Sell | Death cross above 80 | Very High | Aggressive sell | Resistance check |
| Regular Sell | Death cross at 50-80 | Moderate | Scale out | Support check |
| Weak Sell | Death cross below 50 | Low | Wait recommended | Wait for oversold |
Divergence Pattern Strategies
Bullish Divergence
Bullish divergence occurs when price makes a lower low while Stochastic makes a higher low. This is a powerful leading signal that downward momentum is weakening. Many trend reversals actually begin with bullish divergence.
For example, if Bitcoin's price drops from $60,000 to $58,000 while Stochastic rises from 15 to 25, that's bullish divergence. It signals weakening selling pressure, so you should prepare for a potential buy.
Bullish divergence occurring in oversold territory has even higher reliability. If accompanied by a golden cross, this creates a triple confirmation—an extremely strong buy signal.
Bullish Divergence Characteristics
Price: Lower Low Stochastic: Higher Low Meaning: Weakening bearish momentum Signal: Upward reversal imminent
How to Confirm
Compare at least 2 lows Prefer oversold zone (below 20) Higher reliability with volume decrease RSI divergence cross-check recommended
Entry Strategy
Wait for golden cross after divergence Add on previous resistance break Stop loss: Below divergence low Target: Use Fibonacci Retracement Guide
Bearish Divergence
Bearish divergence is the opposite of bullish divergence. It occurs when price makes a higher high while Stochastic makes a lower high. This warns that upward momentum is exhausting.
If Ethereum rises from $4,000 to $4,200 making new highs while Stochastic drops from 85 to 75, that's bearish divergence. It signals weakening buying pressure, so you should consider profit-taking or selling.
Bearish divergence is especially concerning when occurring in overbought territory. Many sharp declines begin with this pattern. Checking overall market conditions using the Bitcoin Dominance Guide is also recommended.
Bearish Divergence Characteristics
Price: Higher High Stochastic: Lower High Meaning: Weakening bullish momentum Signal: Downward reversal imminent
How to Confirm
Compare at least 2 highs Prefer overbought zone (above 80) Higher reliability with volume decrease MACD divergence cross-check recommended
Response Strategy
Wait for death cross after divergence Stop loss or short on support break Target: Previous support zone Consider scaling out on bounces
Hidden Divergence
Hidden divergence signals trend continuation. While regular divergence forecasts trend reversals, hidden divergence indicates the existing trend will continue. In an uptrend, if price makes a higher low while Stochastic makes a lower low, that's hidden bullish divergence.
This pattern is useful for trend-following traders. It can be used to time re-entries after pullbacks. As discussed in the Altcoin Season Guide, hidden divergence appears frequently in strong bull markets.
WawaCoin Outlook
Short-term Trading (1-4H)
Settings: %K 9, %D 3 recommended Buy on oversold golden cross Sell on overbought death cross Stop loss: 2-3% from entry
Swing Trading (Daily)
Settings: %K 14, %D 3 (default) Prefer divergence + crossover combos Confirm with Bollinger Band touches Stop loss: Previous swing low/high
Trend Following (Weekly)
Settings: %K 21, %D 5 recommended Re-enter on hidden divergence Accumulate in oversold zones Combine with long-term S/R analysis
In 2026, cryptocurrency market volatility remains high, making Stochastic's utility even greater. Since Bitcoin ETF approval, institutional capital inflows have improved market efficiency, simultaneously increasing the reliability of technical indicators.
For short-term trading, using Stochastic on 1-hour to 4-hour charts is effective. Bitcoin's daily range often reaches 3-5%, creating favorable conditions for scalping and day trading. However, setting stop losses to prepare for sudden reversals is essential.
For swing trading, focus on daily chart divergence signals. Divergences occurring at major support/resistance levels are particularly reliable. Combining with sentiment indicators covered in the Fear & Greed Index Guide enables more accurate decisions.
Going forward, competition with AI trading bots will intensify. However, understanding fundamentals of classic indicators like Stochastic allows you to predict bot behavior patterns. Strong foundations enable creative application.
Investor Checklist
Essential items to verify before applying Stochastic trading strategies based on this guide.
Verify Indicator Settings
Confirm %K and %D periods match your trading style. Recommended: 9 days for short-term, 14 days for swing, 21 days for long-term trading.
Identify Market Trend
Before applying Stochastic, first determine if the market is in an uptrend, downtrend, or ranging. In strong trends, overbought/oversold signals can be invalidated.
Check Crossover Signals
Verify whether a golden cross or death cross has occurred, and check if it happened in overbought/oversold zones. Zone crossovers have higher reliability.
Examine Divergences
Check if price and Stochastic highs/lows are moving in the same direction. If there's divergence (mismatch), consider potential trend reversal.
Confirm with Other Indicators
Verify signals align with other technical indicators like RSI, MACD, and moving averages. Multiple indicator confirmation filters out false signals.
Set Stop Loss
Always determine your stop loss price before entry. Limiting losses when Stochastic signals are wrong is key to long-term survival.
Frequently Asked Questions
Which is better, Stochastic or RSI?
The two indicators are complementary. RSI measures the speed and magnitude of price changes, while Stochastic measures the closing price's relative position. RSI is better for judging trend strength, while Stochastic is better for precise entry timing. Using both together increases reliability.
Should I sell immediately when overbought?
No. Entering the overbought zone itself is not a sell signal. In strong uptrends, Stochastic can remain above 80 for extended periods. Consider selling when a death cross occurs in the overbought zone or bearish divergence appears.
Are there recommended settings for cryptocurrency?
It depends on volatility. For large-cap coins like Bitcoin, default settings (14, 3) work well. For more volatile altcoins, reducing %K to 9 days provides more sensitive signals. Finding optimal values through backtesting is recommended.
Can Stochastic divergences fail?
Yes, they can. In strong trending markets, divergences can occur multiple times while the trend continues. This is called multiple divergence. Therefore, waiting for actual price reversal confirmation after the divergence signal is safer.
Is Stochastic effective in ranging markets?
Stochastic is quite effective in ranging markets. Since price moves within a defined range, cycles from overbought to oversold and back are clear. However, caution is needed during breakouts as trend changes occur.
What if signals differ across timeframes?
Follow the higher timeframe priority principle. For example, if the daily is overbought but a golden cross appears on the 4-hour, the daily overbought signal takes precedence. Only use lower timeframe signals when they align with higher timeframe direction.
Conclusion
The Stochastic Oscillator is a proven technical indicator that has been trusted by traders for over 70 years since the 1950s. Its utility continues to shine in cryptocurrency markets. The essence of market momentum is captured within the simple principle of %K and %D lines.
First, understanding the basic principle of Stochastic is the starting point. Remember that it shows where the current close sits within the set period's price range as a value between 0-100, with above 80 being overbought and below 20 being oversold.
Second, golden crosses and death crosses are the most fundamental trading signals. Crossover signals occurring in overbought/oversold zones are particularly reliable. However, rather than entering immediately after a signal, the prudence of waiting for a confirmation candle is needed.
Third, divergence patterns are powerful leading indicators that forecast trend reversals in advance. When price and Stochastic directions diverge, observe carefully. Bullish divergence can be a buying opportunity, bearish divergence a selling opportunity.
Fourth, making trading decisions on Stochastic alone is risky. Use it alongside other complementary indicators learned in the RSI Indicator Guide or MACD Indicator Guide. Multiple indicator confirmation greatly helps filter out false signals.
Fifth, setting stop losses is not optional but mandatory. Even the best signals can't be 100% accurate. Always determine your stop loss before entry, and if losses occur, cut them without emotion. Traders who survive long-term are those who manage losses well.
Sixth, adjust settings to match your own trading style. Consider 9 days for short-term trading, 14 days for swing trading, 21 days for long-term investing for %K. The process of finding optimal parameters through backtesting also helps improve your skills.
Mastering the Stochastic Oscillator enables more accurate entry and exit timing in cryptocurrency markets. However, never forget that technical analysis is not magic that predicts markets 100%, but a tool that improves probabilities. Your indicator interpretation abilities will grow alongside consistent learning and experience.